Understanding Centrifugal Pump Curves: A Beginner’s Guide

By Bijan, Founder of Spring Pump
For over two decades, I’ve been knee-deep in the world of industrial pumps. From helping a young engineer select their first pump to troubleshooting complex system failures for seasoned plant managers, one thing remains constant: the universal language of the pump performance curve. It’s the roadmap to your pump’s soul, and learning to read it is the single most important skill you can develop.
Many see a jumble of intersecting lines and intimidating acronyms and shy away. I get it. It can look like abstract art. But I promise you, with a little guidance, it will all click into place. This guide is designed to demystify the process. Consider this a friendly workshop from my experience to your screen. By the end, you’ll be confident in how to read a pump curve and make informed decisions for your applications.
What Exactly is a Pump Curve? The Heartbeat of Your System
Think of a pump performance curve as the pump’s resume. It doesn’t just tell you what the pump can do; it tells you how efficiently it will perform under specific conditions. It’s a graphical representation, published by the manufacturer, that shows the relationship between a pump’s most critical operational parameters: Flow Rate and Total Head.

In my early days, I made the mistake of selecting a pump based on its horsepower or physical size alone. It was a costly error that led to cavitation, excessive energy consumption, and a very short pump life. That hard lesson taught me to always—always—start with the curve.
A proper curve answers the fundamental questions:
- How much liquid (flow) can this pump move against a specific resistance (head)?
- Where does it operate most efficiently?
- What is the maximum pressure it can generate?
- How much energy (horsepower) will it consume to do the job?
- Is it susceptible to cavitation at my desired operating point?
Ignoring this document is like setting off on a cross-country road trip without a map. You might eventually get there, but you’ll waste a tremendous amount of fuel and likely break down along the way. To truly understand how these curves apply, it’s essential to first grasp the fundamental Centrifugal Pump Parts & Functions that make this performance possible.
Deconstructing the Curve: Head vs. Flow and The Key Components
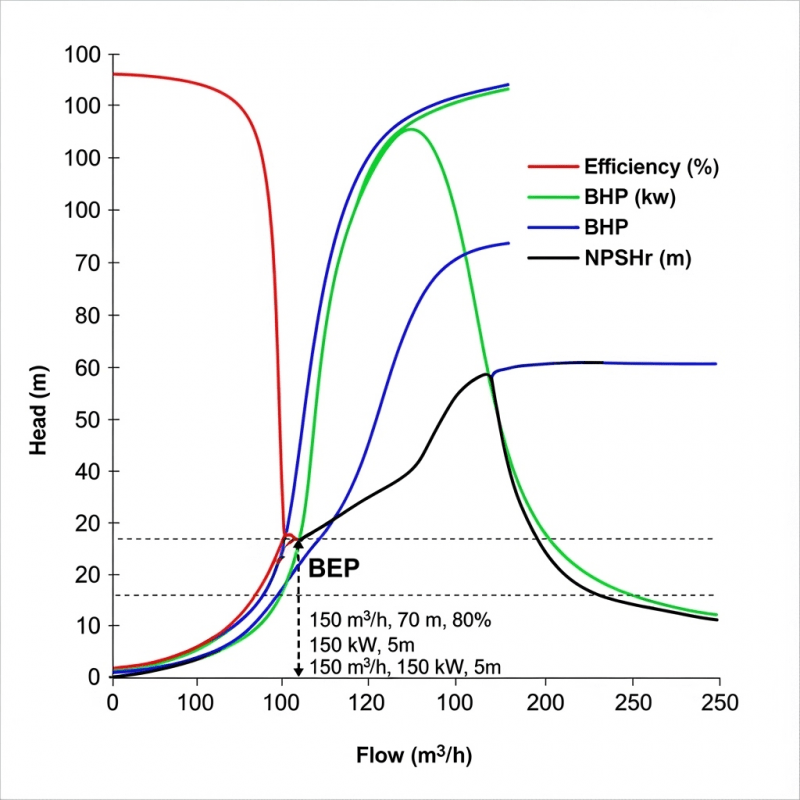
Let’s break down a standard curve into its core elements. I’ve annotated a typical curve below to guide us.
(Image: A clear diagram of a centrifugal pump curve with arrows pointing to and labeling: Flow Rate (Q) on the X-axis, Total Head (H) on the Y-axis, the Main H-Q Curve, the BEP point, the Power Consumption curve, the Efficiency curves, and the NPSHr curve.)
1. The Axes: The Foundation of Everything
- Y-Axis – Total Head (H): This is not pressure. Head is a measure of the energy imparted to the liquid by the pump, expressed in feet or meters of liquid column. It represents the total resistance the pump must overcome, including static lift, friction loss in pipes and fittings, and pressure differences. Head vs. flow is the inverse relationship that defines the curve: as flow increases, the head a centrifugal pump can generate decreases.
- X-Axis – Flow Rate (Q): This is the volume of liquid the pump can move, typically expressed in gallons per minute (GPM) or cubic meters per hour (m³/h).
The main descending line you see is the H-Q curve. It shows all the possible combinations of head and flow that this pump can achieve.
2. The Best Efficiency Point (BEP): The Sweet Spot
This is the holy grail of pump operation. The Best Efficiency Point (BEP) is the single point on the curve where the pump operates at its peak efficiency. It’s where the ratio of hydraulic power output to mechanical power input is optimal.
Why is the BEP on a pump curve so important? Operating at or very near the BEP ensures:
- Longest Lifespan: Radial and axial forces on the impeller and shaft are minimized, reducing wear on bearings, seals, and the impeller itself.
- Lowest Energy Consumption: You’re getting the most work done for the least amount of electricity.
- Lowest Risk of Cavitation: The pump is receiving liquid in the most ideal way, minimizing the chance of vapor bubbles forming.
As a rule of thumb, I always advise my clients at Spring Pump to select a pump where your required operating point is within 80-110% of the BEP flow. Straying too far from this point is where trouble begins.
3. Shut-Off Head: The Pump’s Maximum Effort
Shut-Off Head is the maximum head a pump can generate at a zero flow rate. You see it at the far left of the curve where the H-Q line meets the Y-axis. This is what the pump can produce when its discharge valve is completely closed.
Crucial Insight: While the pump can achieve this, you must never operate it here for more than a few moments. Running at shut-off has no useful work output; all the energy from the motor is converted into heat inside the pump, causing the liquid to rapidly boil, damaging the pump from the inside out. It’s a great way to kill a pump quickly.
4. The NPSHr Curve: Avoiding the Cavitation Catastrophe
This might be the most misunderstood yet critical part of the curve. NPSHr stands for Net Positive Suction Head required.
- What it is: The minimum absolute pressure required at the pump’s suction port to prevent cavitation. Cavitation is the formation and violent collapse of vapor bubbles inside the pump, which sounds like gravel is moving through it and quickly destroys impellers and seals.
- How to read it: The NPSHr curve typically rises sharply as flow increases. This means the pump requires more suction pressure at higher flows to avoid cavitation.
The Golden Rule: The NPSH available in your system (a function of your tank, piping, and liquid properties) must be greater than the NPSH required by the pump, with a safety margin of at least 3 feet (1 meter) or more. If your available NPSH is even slightly below the required, you will have cavitation.
How to Read a Pump Curve: A Practical Walkthrough
Let’s put theory into practice. Imagine you need a pump to move 200 GPM of water against 150 feet of total head.
- Locate Your Flow: Find 200 GPM on the X-axis.
- Draw a Line Up: Draw a vertical line from that point.
- Locate Your Head: Find 150 feet on the Y-axis.
- Draw a Line Across: Draw a horizontal line from that point.
- Find the Intersection: The point where these two lines intersect is your target operating point.
Now, analyze this point:
- Is it on the curve? If your point is directly on the H-Q line, this pump is a perfect match. If it’s above the curve, the pump cannot achieve your required duty. If it’s below, the pump will produce more flow than you need.
- Check the Efficiency: See which efficiency island your point lies in. Is it near the BEP?
- Check Horsepower (BHP): See what power the pump will draw at your operating point. This is crucial for sizing your motor correctly.
- Check NPSHr: At 200 GPM, what is the pump’s NPSHr? You must verify your system can provide more than this.
Selecting the right pump based on this analysis is the key to a successful installation. Our guide on How to Choose a Centrifugal Pump delves deeper into this selection process.
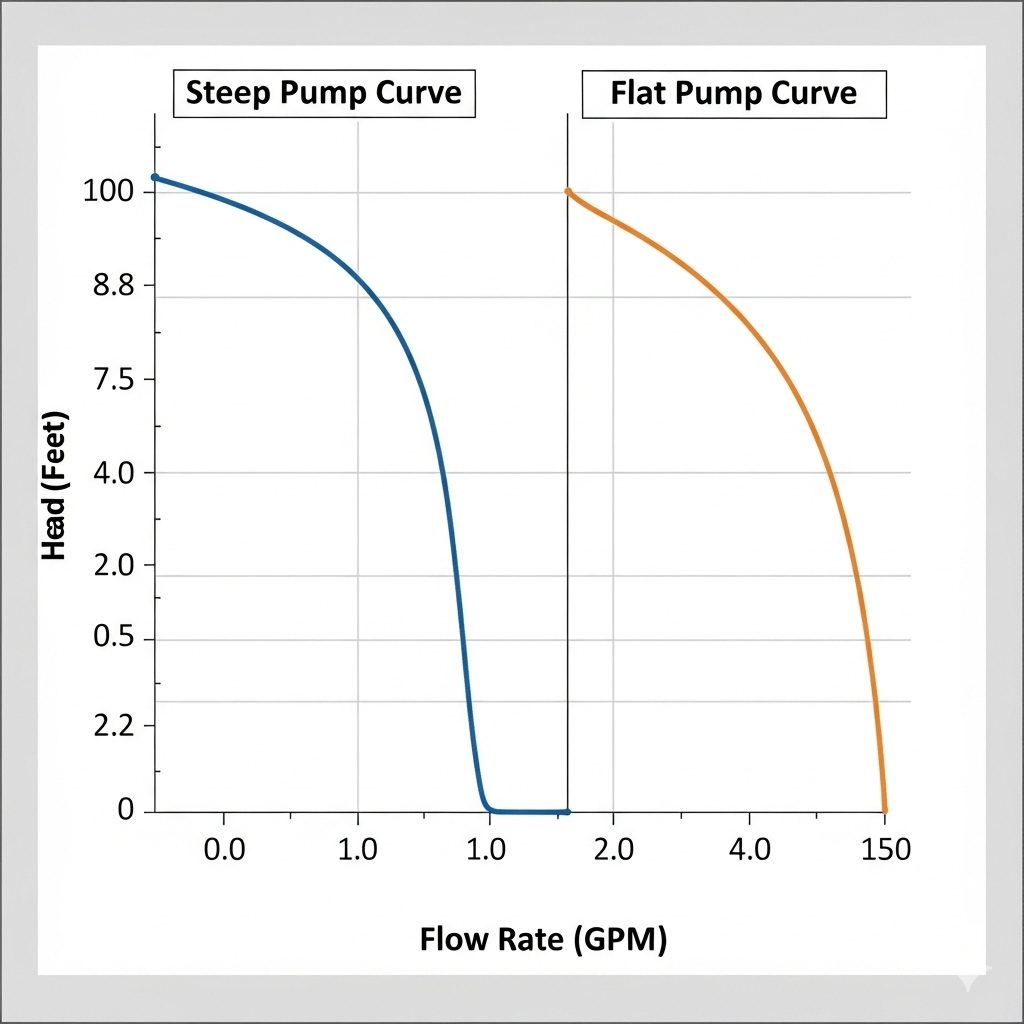
What Does a Steep vs. Flat Pump Curve Mean?
The shape of the H-Q curve tells you a lot about the pump’s character.
- A Steep Curve: What does a steep pump curve mean? It means that flow rate changes very little with significant changes in head. These are great for systems where pressure is the primary variable, like in boiler feedwater or high-pressure washing systems.
- A Flat Curve: This means that head changes very little with significant changes in flow. These pumps are ideal for systems where the main resistance is friction loss in long pipelines.
Common Mistakes to Avoid (Lessons from the Field)
From my experience, here are a few common pitfalls to watch out for:
- Ignoring NPSHr: This is the fastest way to destroy a new pump. Always ensure your system’s NPSHa is comfortably above the pump’s NPSHr.
- Operating Far from BEP: Choosing an oversized pump that operates far to the left of its BEP or an undersized pump that runs far to the right will lead to high energy costs and frequent mechanical failures.
- Forgetting Future Needs: If you anticipate your system’s demand will change, select a pump whose BEP aligns with the most common future operating point.
Conclusion: Your Newfound Superpower
Learning to read a pump performance curve is not just an academic exercise—it’s a practical skill that saves money, prevents downtime, and extends equipment life. It empowers you to have informed conversations with suppliers, troubleshoot system issues, and make smart selections.
Remember the key takeaways:
- The curve maps Head vs. Flow.
- Always target operation near the Best Efficiency Point (BEP).
- Respect the Shut-Off Head—do not operate here.
- Religiously check NPSHr against your system’s available NPSH to avoid cavitation.
At Spring Pump, we don’t just sell pumps; we provide solutions. Every pump in our catalog, from standard to highly specialized models in our Centrifugal Pumps category, comes with full performance data because we believe an educated customer is our best customer. Don’t ever hesitate to reach out to my team with your curve questions—we’re here to help you read the map.
Frequently Asked Questions (FAQs)
Q: How do you read a pump performance curve? A: To read a pump curve, first find your required flow rate on the horizontal (X) axis. Then, find your required total head on the vertical (Y) axis. The point where these two values intersect on the graph shows the pump’s expected performance. You then check this point against efficiency islands, horsepower lines, and the NPSHr curve to see if the pump is a suitable and efficient choice for your application.
Q: What is the BEP on a pump curve? A: The BEP, or Best Efficiency Point, is the point on the pump curve where the pump operates at its highest efficiency. At this point, the pump experiences the least amount of vibration, internal recirculation, and wear, leading to the longest possible service life and lowest energy costs. It is the ideal operating point for any pump.
Q: What is head vs. flow on a pump curve? A: Head and flow have an inverse relationship on a centrifugal pump curve. “Head” is the energy per unit weight expressed as a height of liquid (e.g., feet) that the pump must overcome. “Flow” is the volume of liquid moved per unit of time (e.g., GPM). The curve shows that as the flow rate increases, the pump’s ability to generate head decreases, and vice-versa.
Q: What does a steep pump curve mean? A: A steep pump curve indicates that the pump’s flow rate is relatively insensitive to changes in system head. This means that if the system pressure (head) changes, the flow rate will only change a small amount. This characteristic is desirable in applications where maintaining a nearly constant flow is critical, even if system pressure fluctuates.
